See What's Happening.
Know What's Next.
EdgeVero transforms breaking news, market activity, dilution data and historical patterns into actionable intelligence—so you can understand what's happening now and anticipate what could happen next.
Every trade starts with the same four questions
EdgeVero answers all of them on one screen, while the stock is still moving.
What's happening?
Intelligent breaking news
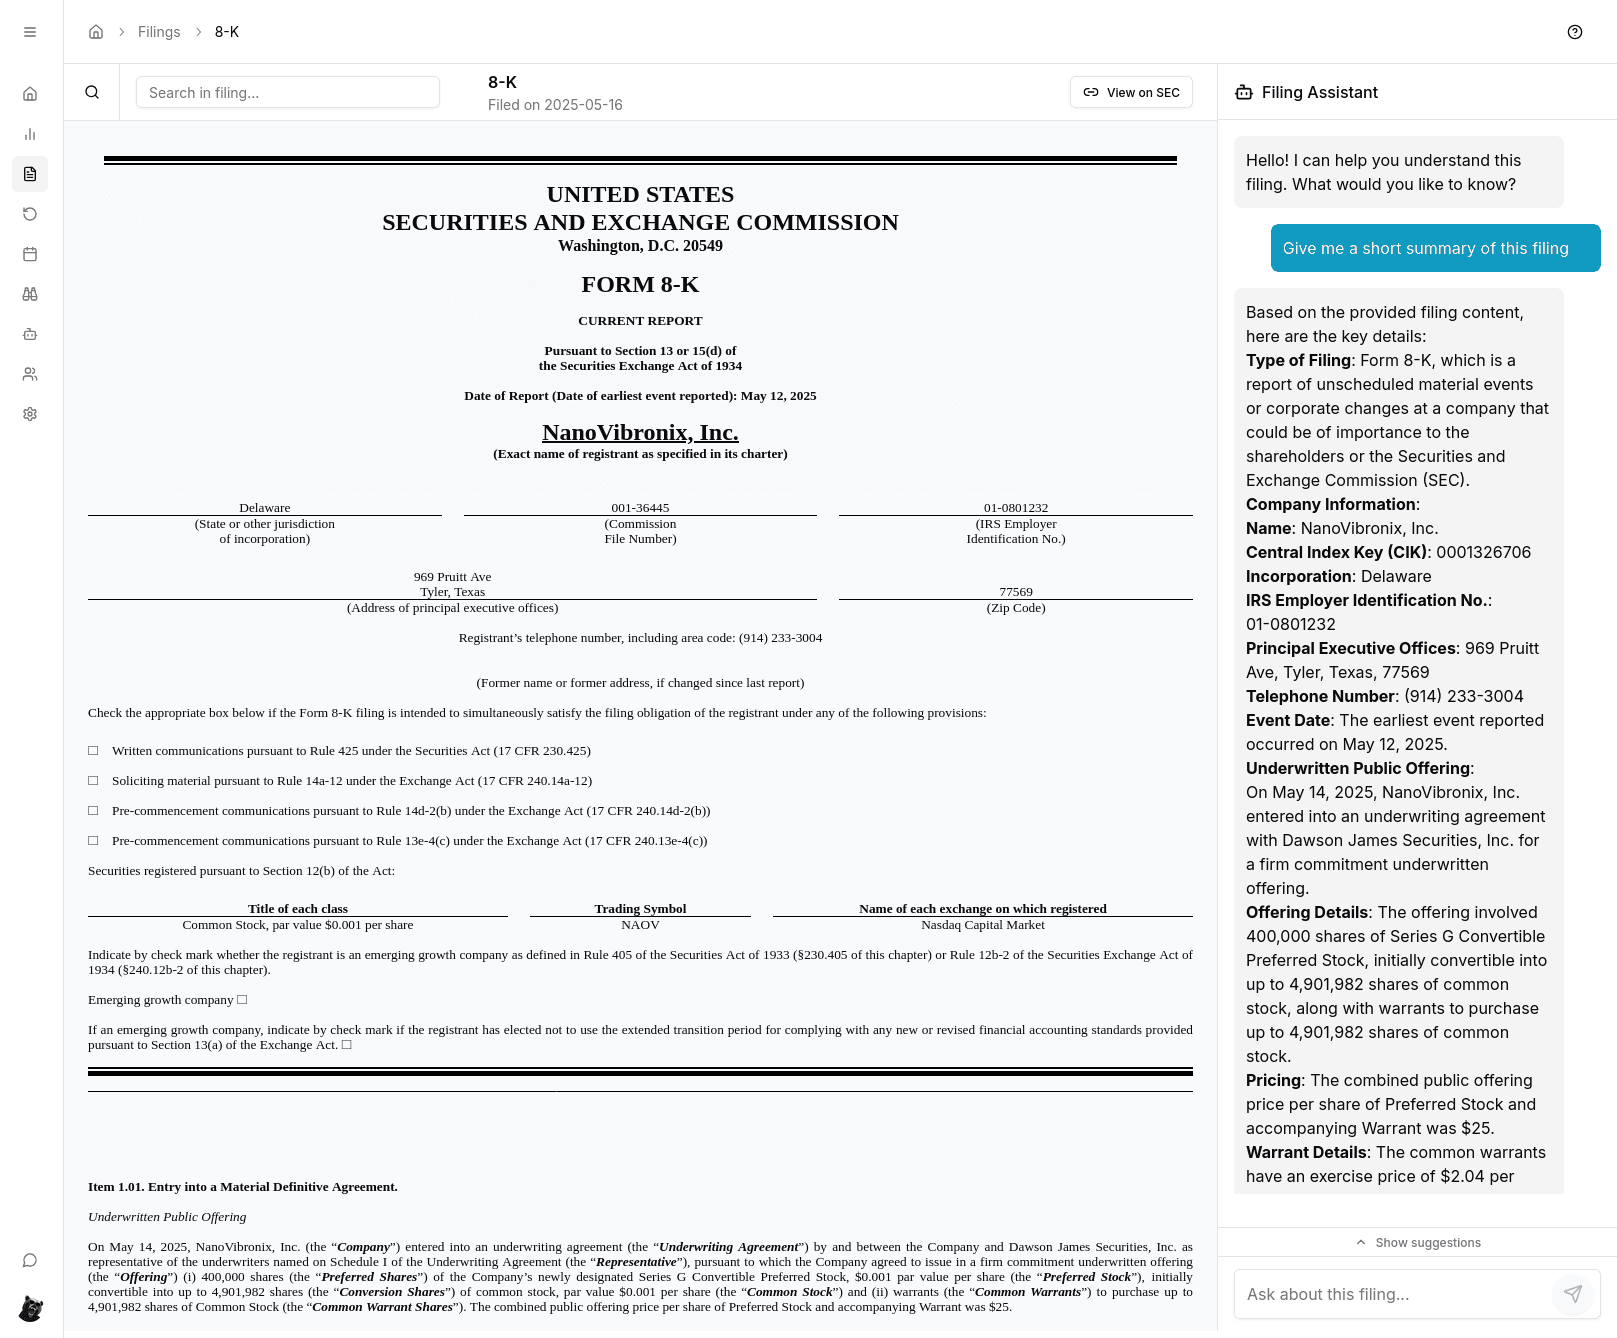
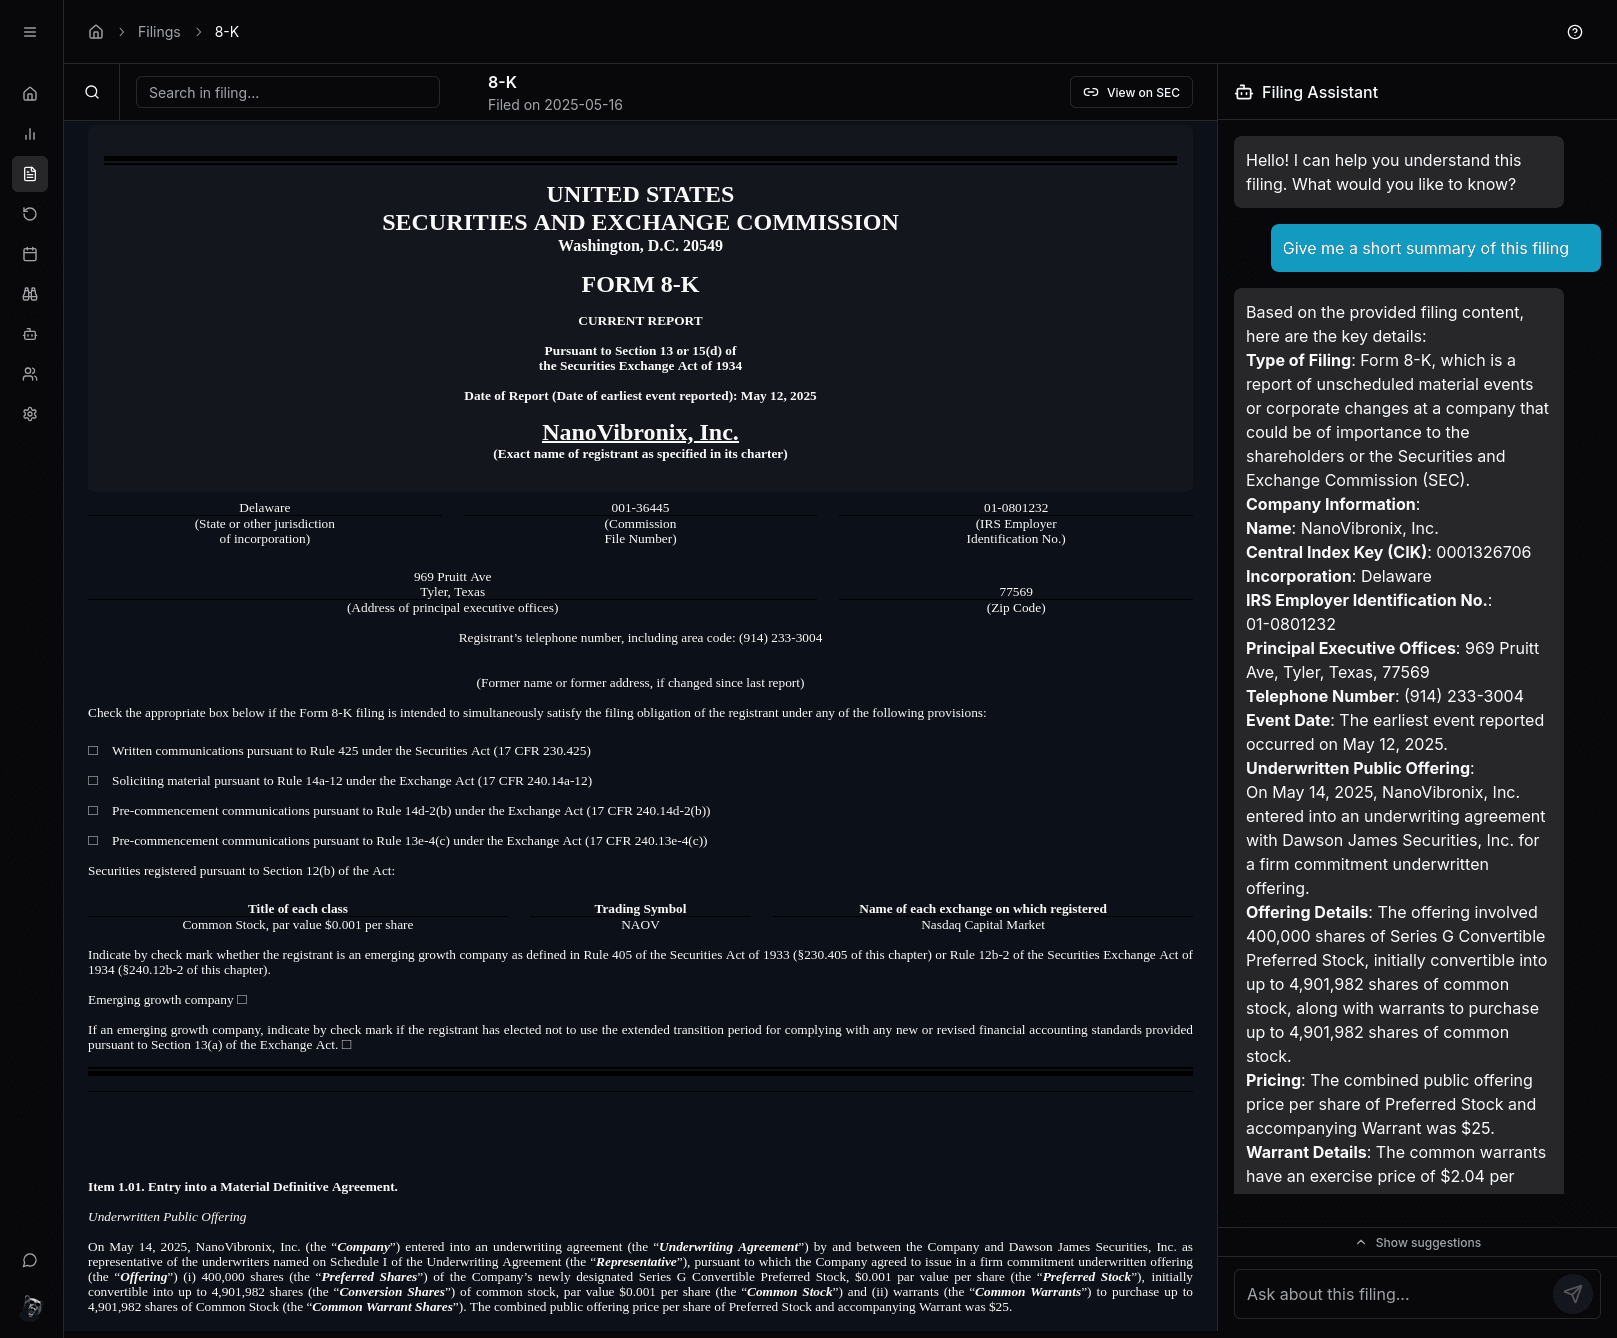
Market news, press releases and SEC filings land in one live stream. Every filing is read for you, so you know in seconds whether it is an offering, a warrant deal or a delisting notice.
- Market news, press releases and SEC filings in one live stream
- Every SEC filing in plain English within about a minute
- AI summaries that read the full filing, bottom line first
- Offerings, warrants, reverse splits and delisting notices called out
What's moving right now?
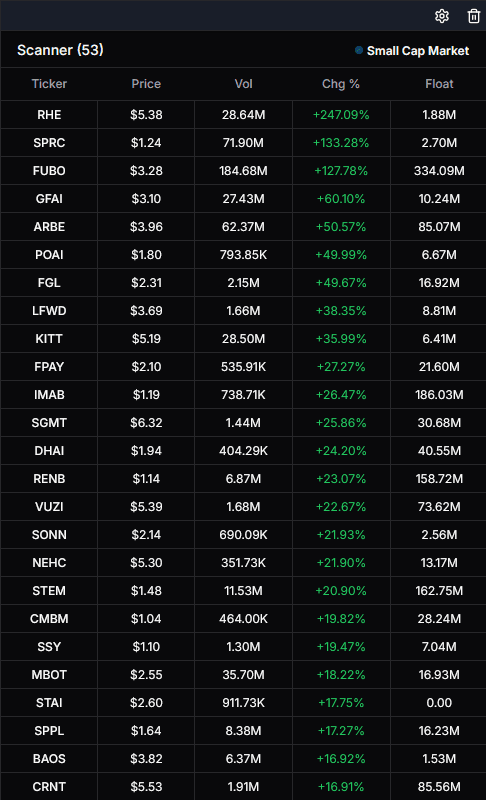
Actionable scanner
Scanners that tell you why a stock is moving, not just that it is. A flame next to the symbol means fresh news; hover it to read the headline without leaving the scan.
- News flame next to the symbol, headline on hover
- Custom filters plus ready-made gapper, momentum and after-hours scans
- Scheduled filter changes from premarket to after hours
- Voice alerts
How dangerous is the dilution?
Deep dilution intelligence
Before you trade a runner, see how much stock the company can still sell: shelf room after the baby-shelf rule, ATM left, warrants and convertibles, and how fast the share count has grown.
- Dilution Now: ATM left, resales, warrants, convertible notes
- Baby-shelf rule: how much the company can actually sell
- Share count growth, reverse splits, raises, cash runway
- Overall dilution risk rating
What has this stock historically done?
Advanced gap intelligence
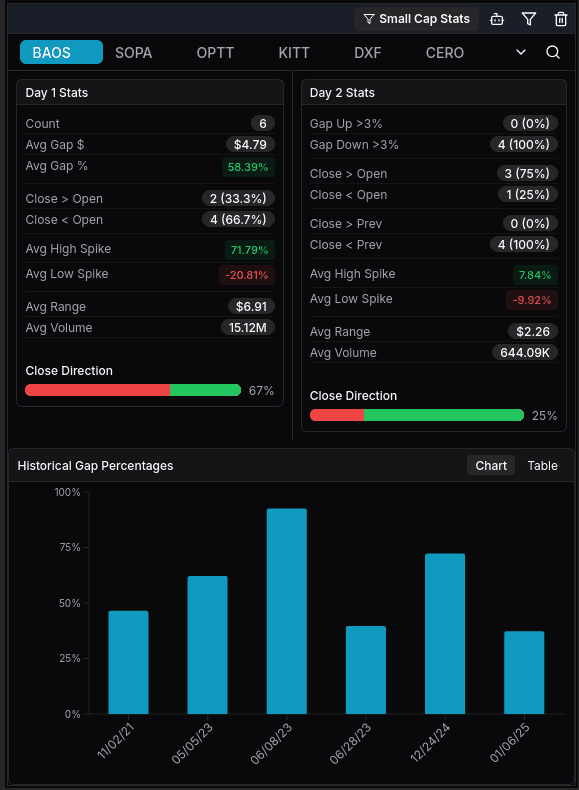
Every past gap of the stock in one table, with Day 1 and Day 2 stats, the average move by hour and the intraday chart of any of those days, one click away.
- Every gap of the past 2 or 5 years, filtered your way
- Day 1 and Day 2 stats: green vs red, spike, high, low, close
- Average move by hour across its gap days
- One-click intraday chart of any past gap day
Stop piecing it together. Start trading it.
Other traders flip between a scanner, a news terminal, a filings site and a spreadsheet. On EdgeVero it is one screen, and the widgets follow the symbol you click.
The scanner flags it
A small cap is up 80% premarket. The flame next to the symbol says there is news.
The news explains it
One hover shows the headline; one click shows the AI summary of the press release or filing.
Dilution Now sizes the risk
Under the offering filing: how much is left on the ATM, which warrants can be exercised, what the baby-shelf rule still allows.
Gap history sets expectations
How this stock behaved on its past gap days: how often it closed red, how high it spiked, when it usually turned.
Historical patterns don't guarantee future results. EdgeVero provides information, not investment advice.
Frequently Asked Questions
See what's happening. Know what's next.
Replaces three tools. Costs a fraction of them. Try every feature free for 7 days.